Comparative genomics of nitrogen-fixing organelle (nitroplast) endosymbionts reveals extensive metabolic reduction and two distinct species
The diazotroph Candidatus Atelocyanobacterium thalassae (UCYN-A) has evolved from a symbiotic relationship to functioning as a specialized eukaryotic organelle dedicated to nitrogen fixation, known as the nitroplast. This is of great importance as it constitutes a key component of global oceanic nitrogen fixation. In this study, we present the pangenome of Ca. Atelocyanobacterium, encompassing eight genomes currently classified within this genus. Additionally, we expanded the comparative framework to include 513 genomes from the order Chroococcales, providing a broad phylogenomic context that enabled robust resolution of UCYN-A’s evolutionary position and functional adaptations. Our analyses revealed extensive metabolic reductions across all genomes, including deficiencies in essential pathways such as the Calvin and Krebs cycles, photosystem II, and amino acid and carbohydrate biosynthesis, along with the absence of RuBisCo. Despite these reductions, the universal presence of nitrogen fixation genes highlights UCYN-A’s specialized symbiotic role within the marine alga Braarudosphaera bigelowii. We uncovered a previously unrecognized divergence within the genus, revealing the existence of two distinct species: Ca. Atelocyanobacterium thalassae and Ca. Atelocyanobacterium braarudosphaerae sp. nov. This taxonomic refinement is supported by consistent differences in pairwise average nucleotide identity (ANI), phylogenomics, gene synteny, and metabolic content analyses. This research not only provides valuable insights into the genomic adaptations that enable UCYN-A to thrive as an endosymbiont but also lays the groundwork for future studies on symbiosis and protein transport mechanisms. Understanding UCYN-A's unique biology could drive new biotechnological strategies for enhancing nitrogen fixation and promoting sustainable agricultural development.
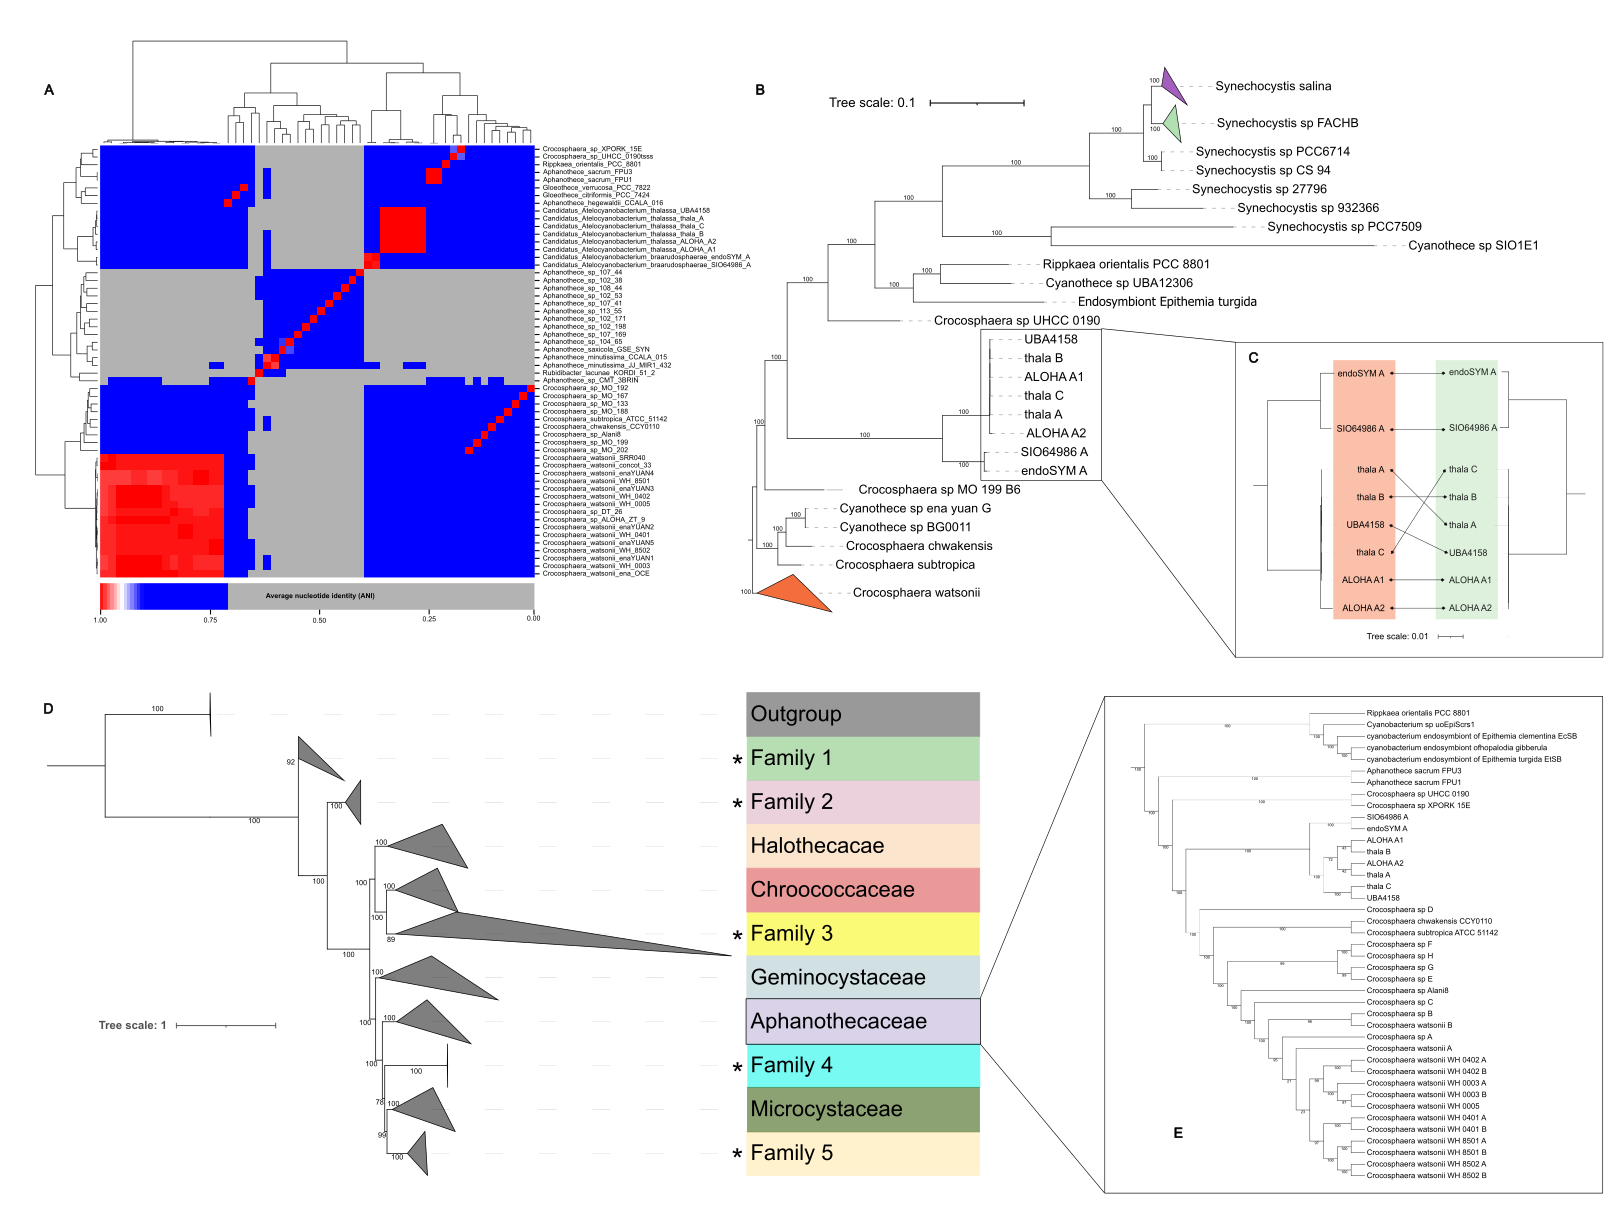
Fig. 1: Average nucleotide identity (ANI) and phylogenomics. (A) ANIb heatmap showing pairwise comparisons among the genomes of Ca. Atelocyanobacterium and related species (B) Phylogenomic tree based on the Bac71 dataset, highlighting the separation between the thalassae and braarudosphaerae groups. (C) Tanglegram comparing phylogenomic trees based on core genes and the Bac71 dataset, showing consistent clustering of the two phylogroups. (D) Phylogenomic tree of the order Chroococcales constructed from 513 genomes using the Bac71 dataset. Newly proposed families are indicated with an asterisk (*). (E) Expanded view of the family Aphanothecaceae, showing the two Ca. Atelocyanobacterium phylogroups.
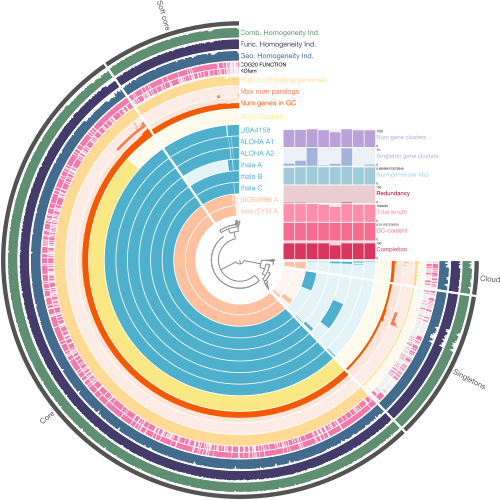
Fig. 2: Overview of the Candidatus Atelocyanobacterium pangenome structure. The genomes are organized according to a gene presence/absence clustering tree, showing the different components of the pangenome: core, soft core, accessory, and unique gene clusters (singletons) across the analyzed genomes. The outer rings show details of single-copy gene clusters, including gene counts, the genomes they contribute to, and homogeneity indices. Bar charts provide key genomic metrics. In the upper right section additional genomic metrics are presented, including redundancy, completeness, the number of singleton gene clusters, the total number of gene clusters, and GC content. Gene clusters with known functions in the clusters of orthologous groups (COGs) and KEGG orthology (KOfam) databases are shown in pink, while those with unknown functions are depicted in gray.
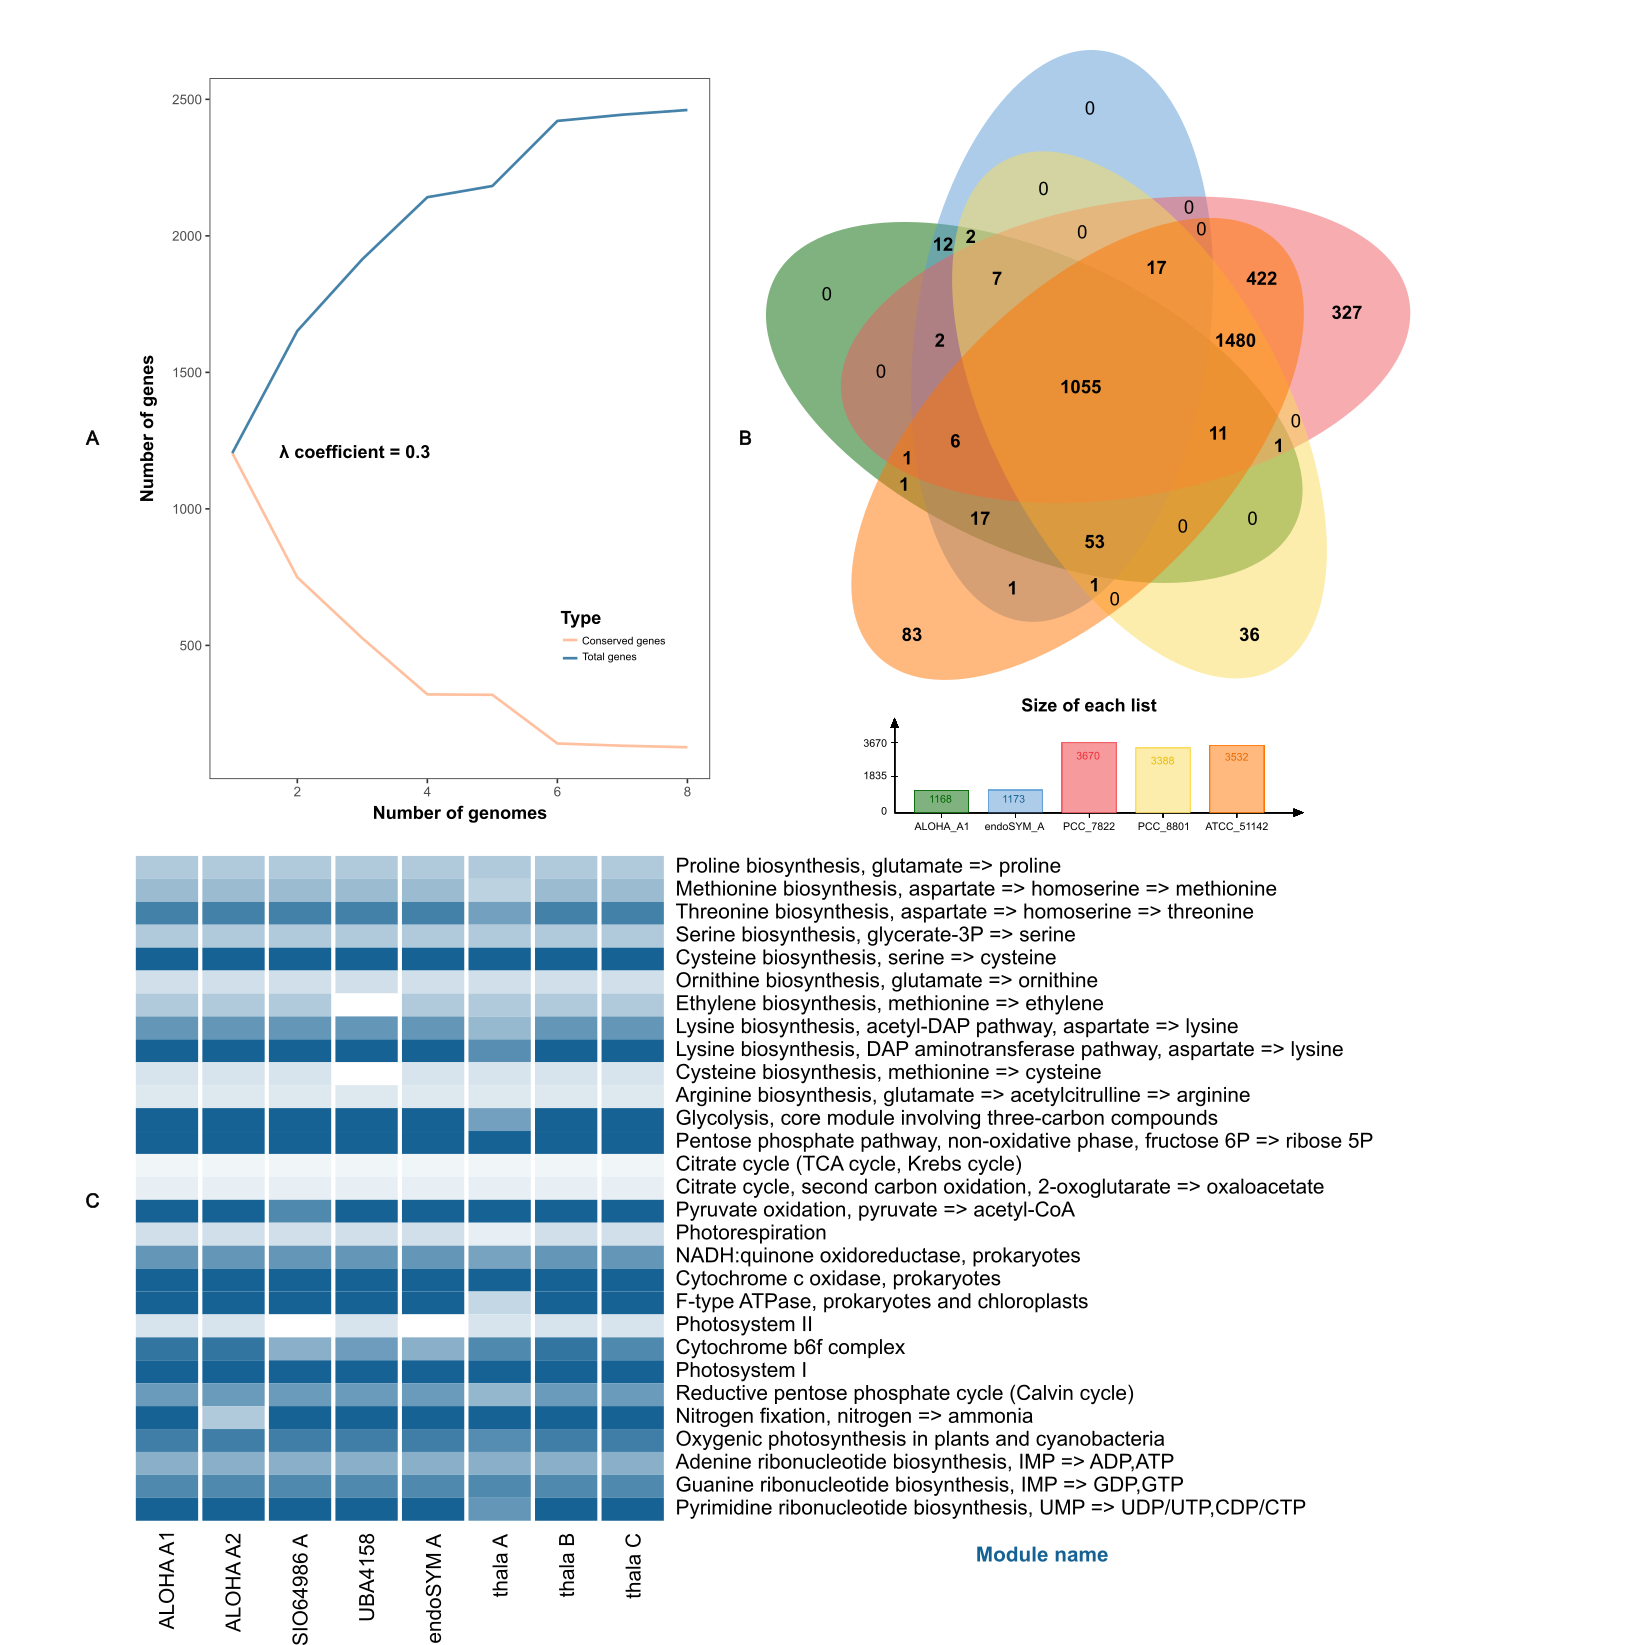
Fig. 3: Pangenome analysis and functional comparison of Ca. Atelocyanobacterium genomes.(A) Rarefaction curve showing the relationship between conserved genes and total genes across the pangenome of Ca. Atelocyanobacterium. The curve follows Heap’s Law, with the gamma coefficient (λ) displayed to indicate whether the pangenome is open or closed. (B) Venn diagram generated by OrthoMCL, comparing the complete and reference genomes within the family Aphanothecaceae. Each genome is represented by a different color. The diagram also includes a bar chart displaying the size of each orthologous gene list. (C) Heatmap of essential KEGG pathways across Ca. Atelocyanobacterium genomes. The intensity of the blue color represents the completeness of each KEGG module, providing a visual assessment of pathway integrity within each genome.