Candidatus Liberibacter asiaticus: A large-scale comparative genomic analysis
Candidatus Liberibacter asiaticus (CLas), the fastidious agent of Huanglongbing (HLB), remains a major threat to global citriculture, largely due to gaps in our understanding of its biology and evolution. This study contributes to these gaps through a large-scale pangenomic analysis, leveraging 178 high-quality genomes to construct a genomic framework for this globally significant pathogen. Our analysis revealed a pangenome of 1,932 gene clusters characterized by a large core genome and a significant accessory component. We identified that the core genome encodes essential machinery for host interaction, including components of flagellar apparatus for motility, and an arsenal to maintain cellular homeostasis under the diverse stresses of the phloem environment, such as osmotic pressure, thermal adaptation, and host-induced oxidative stress. The accessory genome harbors a repertoire of putative virulence factors, including multiple conserved protein secretion systems like the essential Sec-dependent pathway, which delivers effector proteins that manipulate the host. Furthermore, analysis of the pangenome graph predicted multiple genomic islands that are likely fundamental to the pathogen's adaptive dynamics. Notably, despite this observed variability in the accessory genome, quantitative modeling shows the pangenome is functionally closed and exhibits remarkably low fluidity. This indicates that CLas rarely acquires novel gene families and primarily evolves via the turnover of existing accessory genes, a finding consistent with its specialized, obligate intracellular lifestyle. A key finding was the high degree of synteny and collinearity within CLas strains, a trait that contrasts sharply with the extensive architectural rearrangements observed across the broader Liberibacter genus. This work provides an unprecedented, high-resolution view of the CLas pangenome. For an unculturable organism, such a comparative genomic approach is fundamental, offering a complete genetic blueprint where traditional microbiology is difficult. By elucidating the unique evolutionary strategy of CLas and identifying a catalog of functionally critical genes, this research offers a foundational resource for designing rational, targeted strategies. The results identify novel targets for diagnostics and therapeutic intervention, thereby contributing directly to the urgent global effort to control HLB.
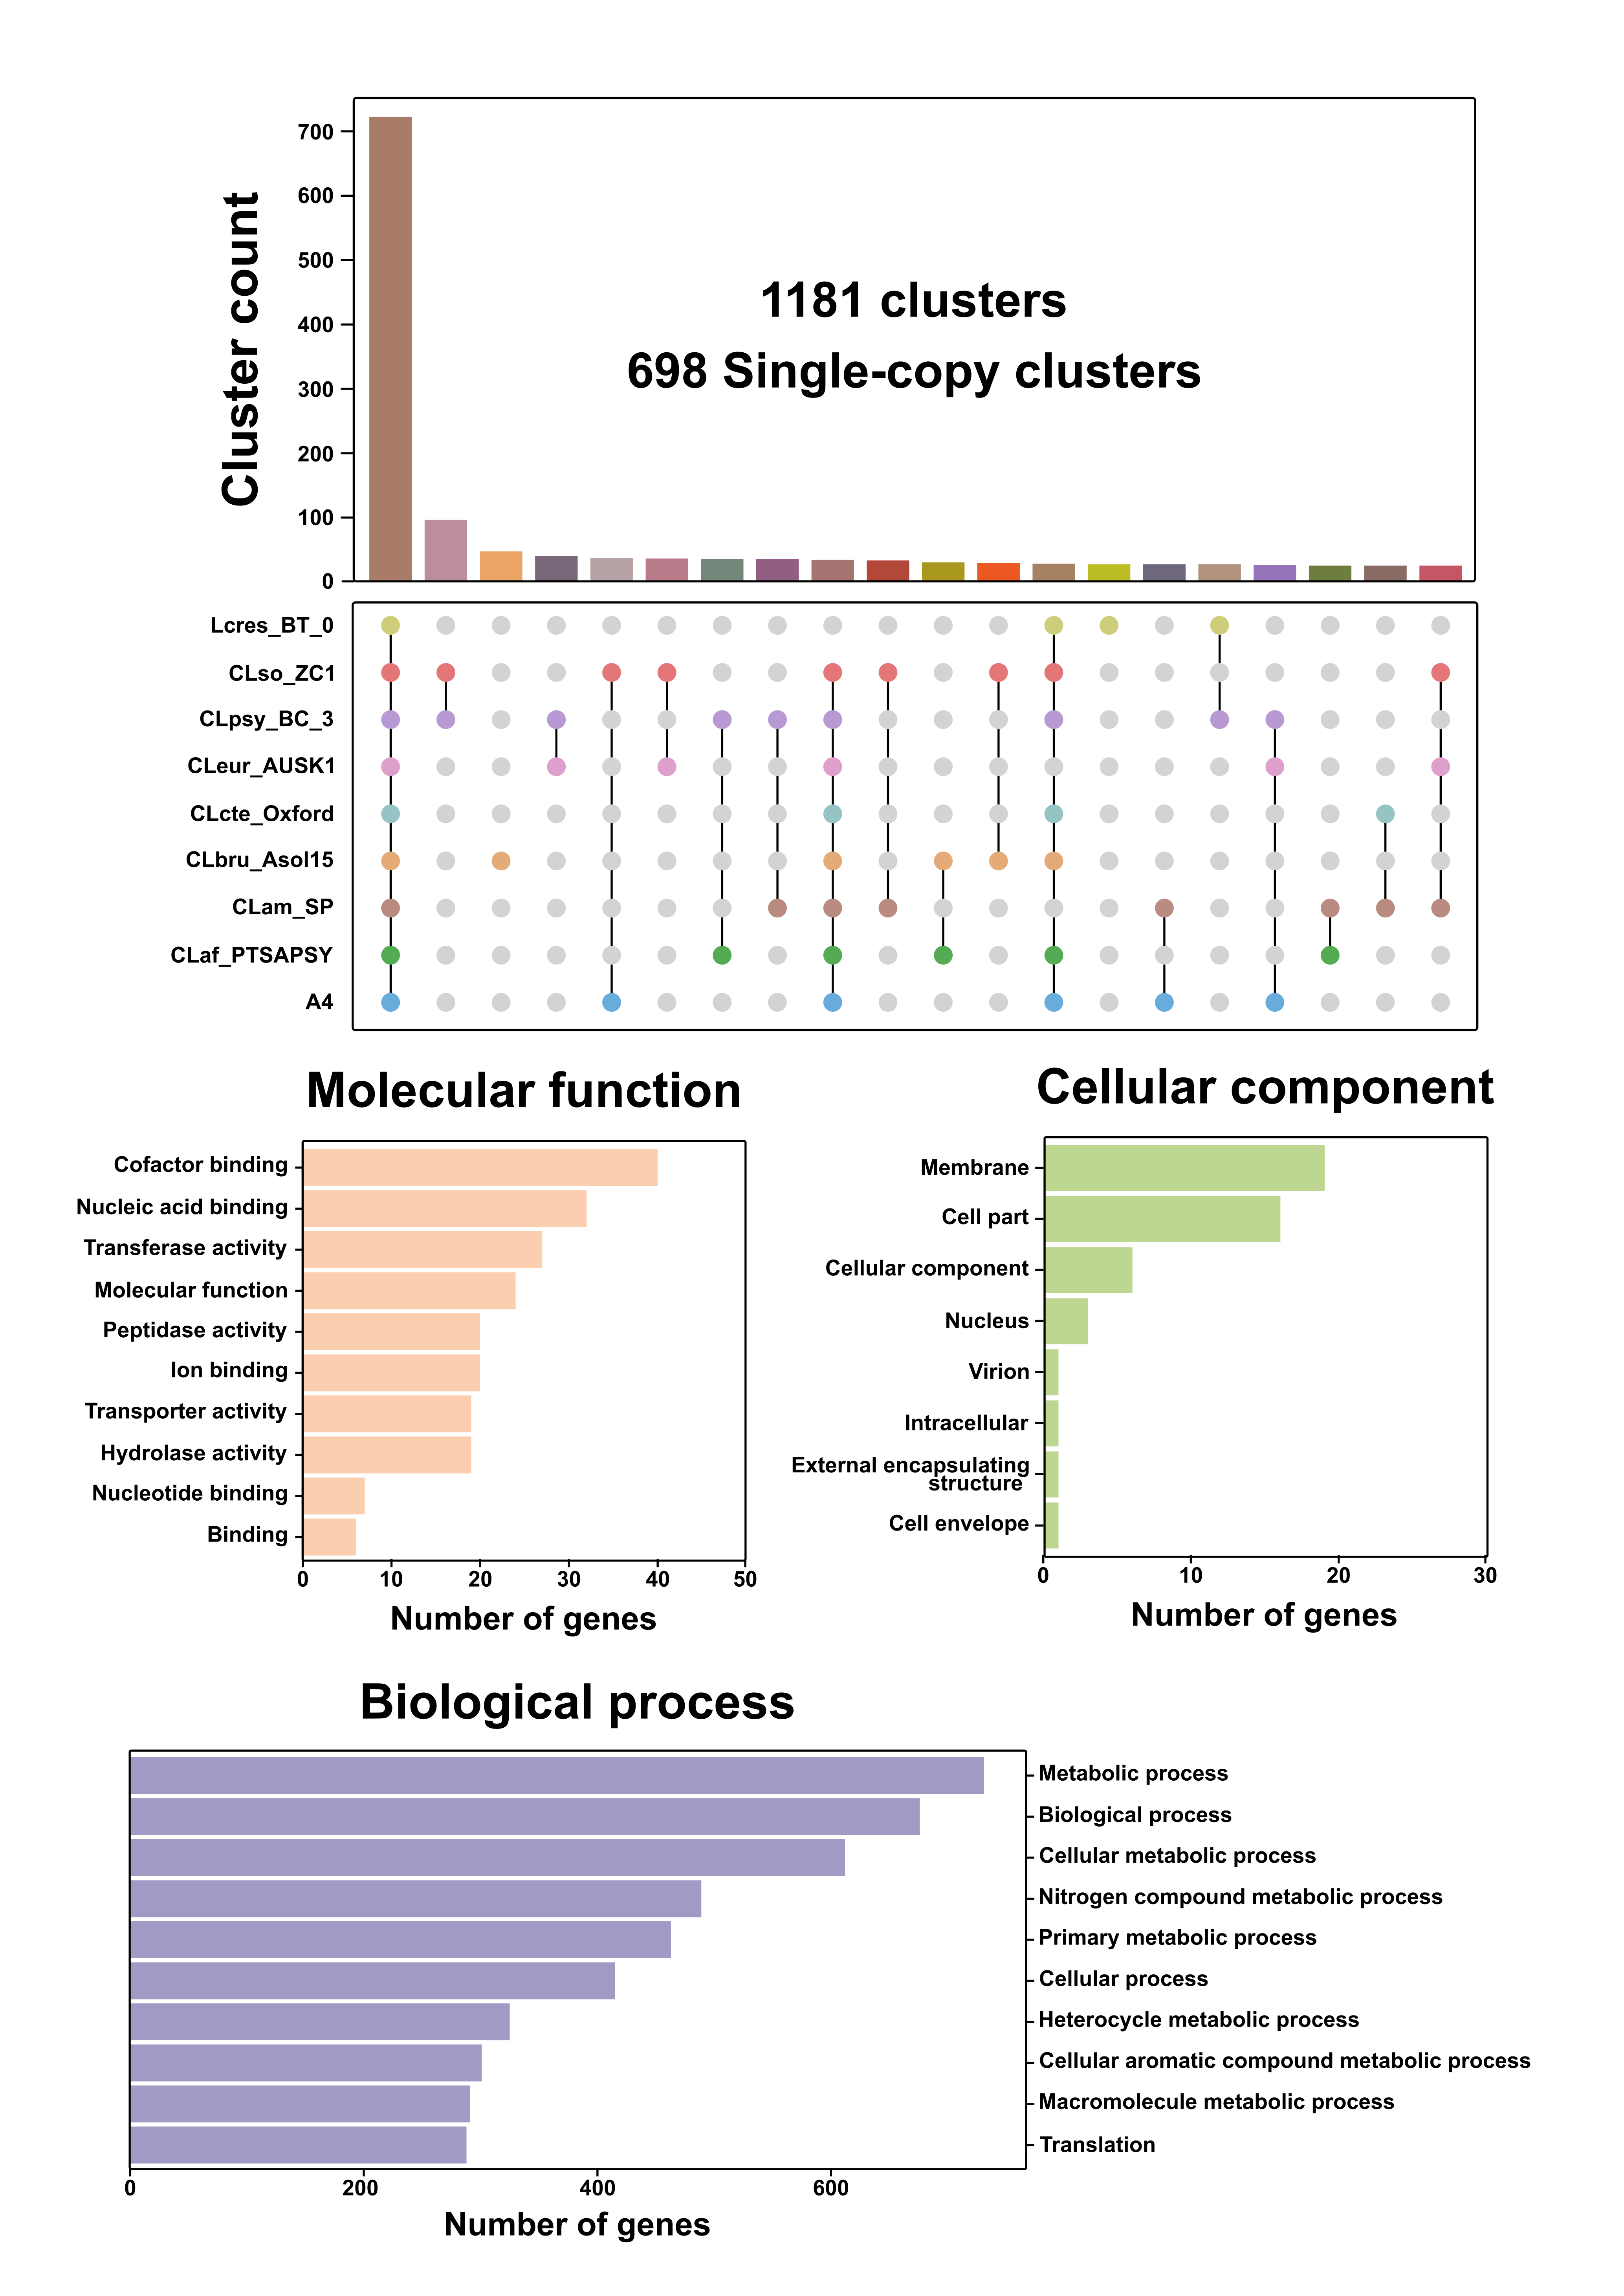
Fig. 1: Comparative genomic analysis and functional annotation of nine Liberibacter species. (a) Distribution of single-copy gene clusters. The top bar chart indicates the number of clusters for each intersection of species. The matrix below uses connected dots to show which species are present in a given intersection; the leftmost bar represents the core genome of 721 clusters present in all nine species. (b) Gene Ontology (GO) term for the 698 single-copy orthologous clusters, categorized by Molecular Function, Cellular Component, and Biological Process. The x-axis represents the number of genes assigned to each GO category.
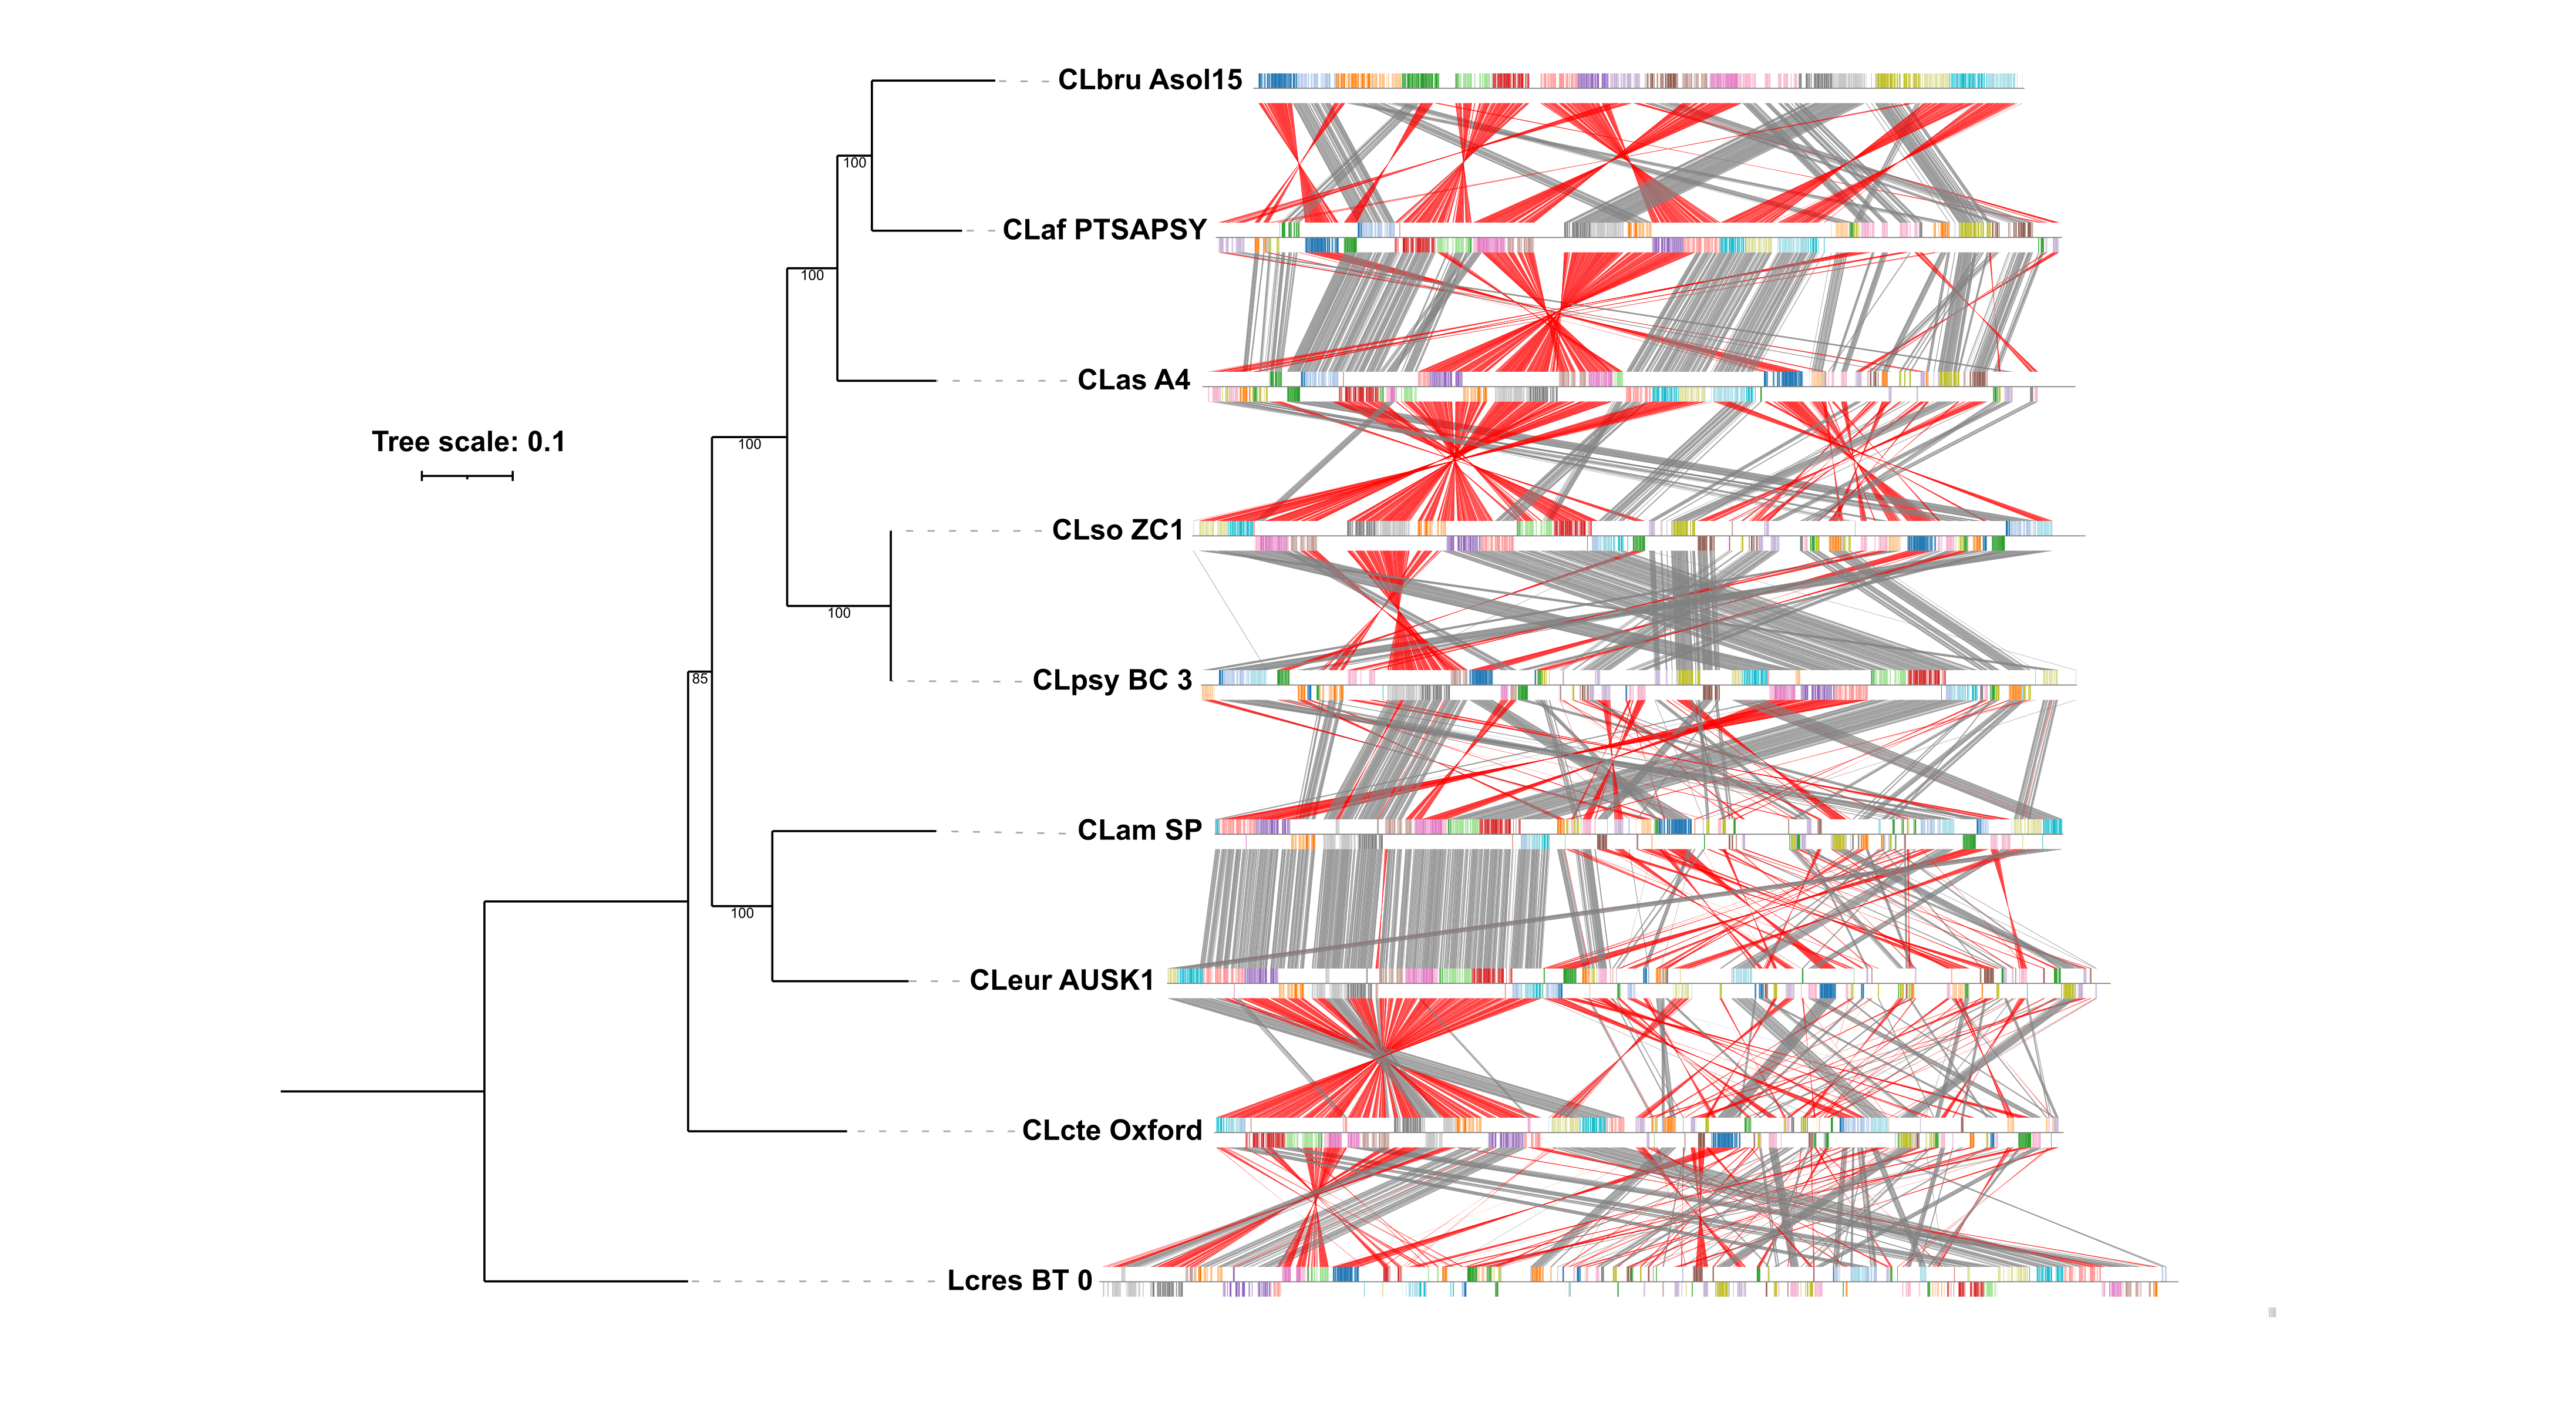
Fig. 2: Whole-genome alignment of the Liberibacter genus. The figure displays a whole-genome alignment generated with progressiveMauve comparing the nine Liberibacter species. On the left, a phylogenomic tree constructed with GToTree, using a set of Alphaproteobacteria single-copy genes, shows the evolutionary relationships between the species; numbers at the nodes represent bootstrap support values. On the right, the structural alignment is shown. Each genome is a horizontal track, and homologous regions are represented as colored Locally Collinear Blocks (LCBs). The color links matching blocks across genomes, while the position of a block above or below the central axis indicates its orientation. A block that flips to the opposite side in another genome represents a genomic inversion.
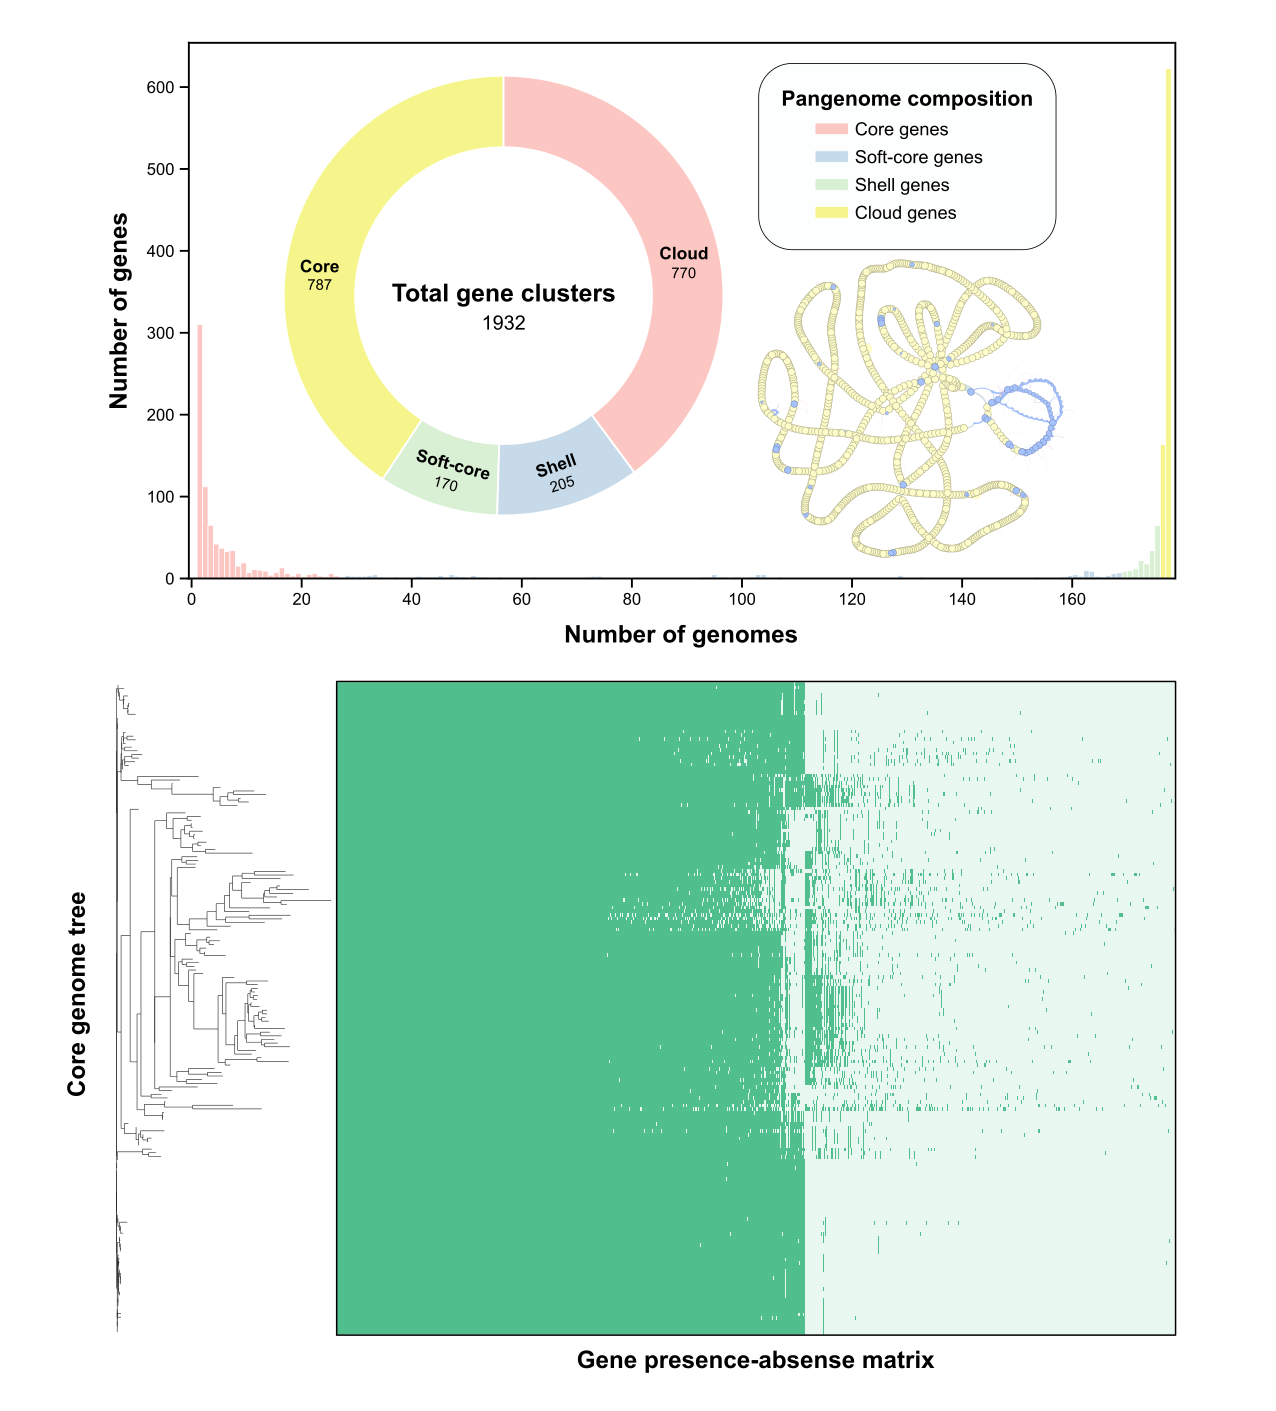
Fig. 3: Pangenome structure of the Candidatus Liberibacter asiaticus population.The top left panel illustrates the pangenome composition, partitioning the total 1,932 gene clusters into core (yellow), soft-core (light green), shell (blue), and cloud (red) genes, with a background histogram showing the distribution of gene cluster frequency across all genomes. The top right panel displays the pangenome graph, visualizing the connectivity between core and accessory gene clusters. The bottom panel consists of the gene presence-absence matrix, with rows representing individual genomes and columns representing gene clusters, ordered according to the core genome phylogenetic tree shown on the left.